Monitoring GitHub releases with Prometheus
I have written some exporters to observe things on GitHub. This is how and why. We will talk …

As a DevOps/SRE, I spent a reasonable amount of time dealing with metrics and alerts.
Usually, companies start with none or few monitoring.
One day, they realize they need metrics, alerts, and all the gang.
Sure, this will help them fix problems and outages faster, so, they start adding them.
Every outage leads to more metrics and more alerts, because “we didn’t had enough data”.
Sooner or later, they reach an over-monitoring state.
This is how our team have been trying to fix alerts here at ContaAzul.
You arrived at the office by 8AM, check your inbox and see 500 alert emails from the previous night…
All last night’s alerts won’t fit on one page in PagerDuty.
— @sadoperator, May 13, 2015
But, everything is working fine now, so, let’s just delete them, right?
No, please don’t.
That was our modus operandi for a while (and still is somedays). Doing that doesn’t fix any single problem.
These kinds of ignorable alerts seem to reproduce, so, every week you will have more of them.
Marking alert emails as spam doesn’t make them go away.
— @sadserver, January 6, 2016
That’s why we decided to start fixing them.
The topic title make it looks easy, but it isn’t.
@sadserver “We’re spending too much on @pagerduty!”
What if we fix things?
“Nah, let’s just send less alerts”
— @sadoperator, March 2, 2016
The following topics are tips that I found in my quest through the “Dark Cave of Thousand Alerts”.
Pretty obvious, I know. But do it.
Most useless alerts can be permanently fixed somehow.
Disks full of logs? Rotate them!
Memory leaks? Fix the code!
Backup script isn’t working deterministically? Fix it!
Imagine that old system that every once in a while needs a reboot. So, you fire an alert when it needs to be rebooted (for example, the process is using too much memory). Instead of firing an alert, that you would have to ACK, SSH into the server and restart the service, why not just restart the service?
I know, it feels like that if you do that, it will never be fixed.
Yeah, it wouldn’t anyway.
If you can’t fix the root cause, then focus on what you can do: automate the task and alert the owner of the service .
Focus on the things you can fix.
Sometimes alerts’ thresholds are too soft. Just changing it may already avoid the thousand emails.
Sometimes the alerts just need to be time-based.
For example, we have a script that runs only on business hours to autoscale our Travis Enterprise workers with AWS Spot Instances.
We also have an alert that fires if there are any queued jobs on Travis.
That alert should fire if, for any reason, Travis isn’t working.
With that setup, if someone opens a pull request on the weekend (which is kind of usual), it will stay queued until Monday morning.
This entire time, alerts would fire, and I won’t do anything, because it isn’t a real problem.
The fix?
-*/5  * * * *  root  bash /blah/scripts/travis_queue_check.sh
+*/5 8-18 * * 1-5 root  bash /blah/scripts/travis_queue_check.sh
It was easier to do that than it was to erase emails every morning.
If the alert has no action, it shouldn’t fire. Tune it until it makes sense.
In Brazil, we have this crap called NF-e (electronic invoice). It isn’t an invoice like those you get if you buy something in EUA, for example.
It is a XML file that follows a complicated set of rules. This file should be signed and sent to one of the government SEFAZ servers. Guess what: these services go down all the time. And there is nothing we can do.
ContaAzul issues these kind of invoices, so, we wrote a script that queries our database and alerts us if the queue is growing too fast. This way, we can let our clients know that it’s a Government problem, not ours.
These kind of alerts are important. Before that, each time a SEFAZ server went down, our support team was flooded with phone calls from our clients complaining that they couldn’t issue invoices.
We have tons of alerts like this. If you have features like that, it might worth to alert it too.
Some of your alerts shouldn’t be alerts. Maybe they are just metrics. Maybe they’re alerting based on wrong triggers.
“It kept alerting me, so I disabled the alert”
— @sadserver, May 12, 2015
Rob Ewaschuk’s excellent “My Philosophy on Alerting” paper has some very good points about this subject.
He defends that cause-based alerts aren’t as good as symptom-based alerts, for 3 reasons:
For example:
Database queries are slow: cause-based. You just assume this will make your application slow too;Application response time > 100ms: symptom-based. You know that the app is slow, but you don’t know what is causing it. A metrics dashboard would solve that.He also defends that it’s better to alert from “outside”, from the same perspective of the client.
By the way, there is an entire chapter about alerts in the famous Site Reliability Engineering: How Google Runs Production Systems book.
That being said, this is particularly hard to follow.
We did disable some alerts and never looked back, but, most of them are still there. You may want to try and see what happens.
Sometimes problems occur, and you can’t find the root cause. That’s common with distributed systems and microservices. Lots of things can go wrong, and it’s hard to find what went wrong when they do.
We use Hystrix for circuit-breaking dependencies.
We also use hystrix-dashboard to see what’s going on right now.
The problem is that we were constantly missing information because the dashboard
doesn’t store any.
That’s why we created hystrix-to-librato.
It basically reads a Hystrix/Turbine stream and sends the metrics to Librato in an infinite loop. Works for us:
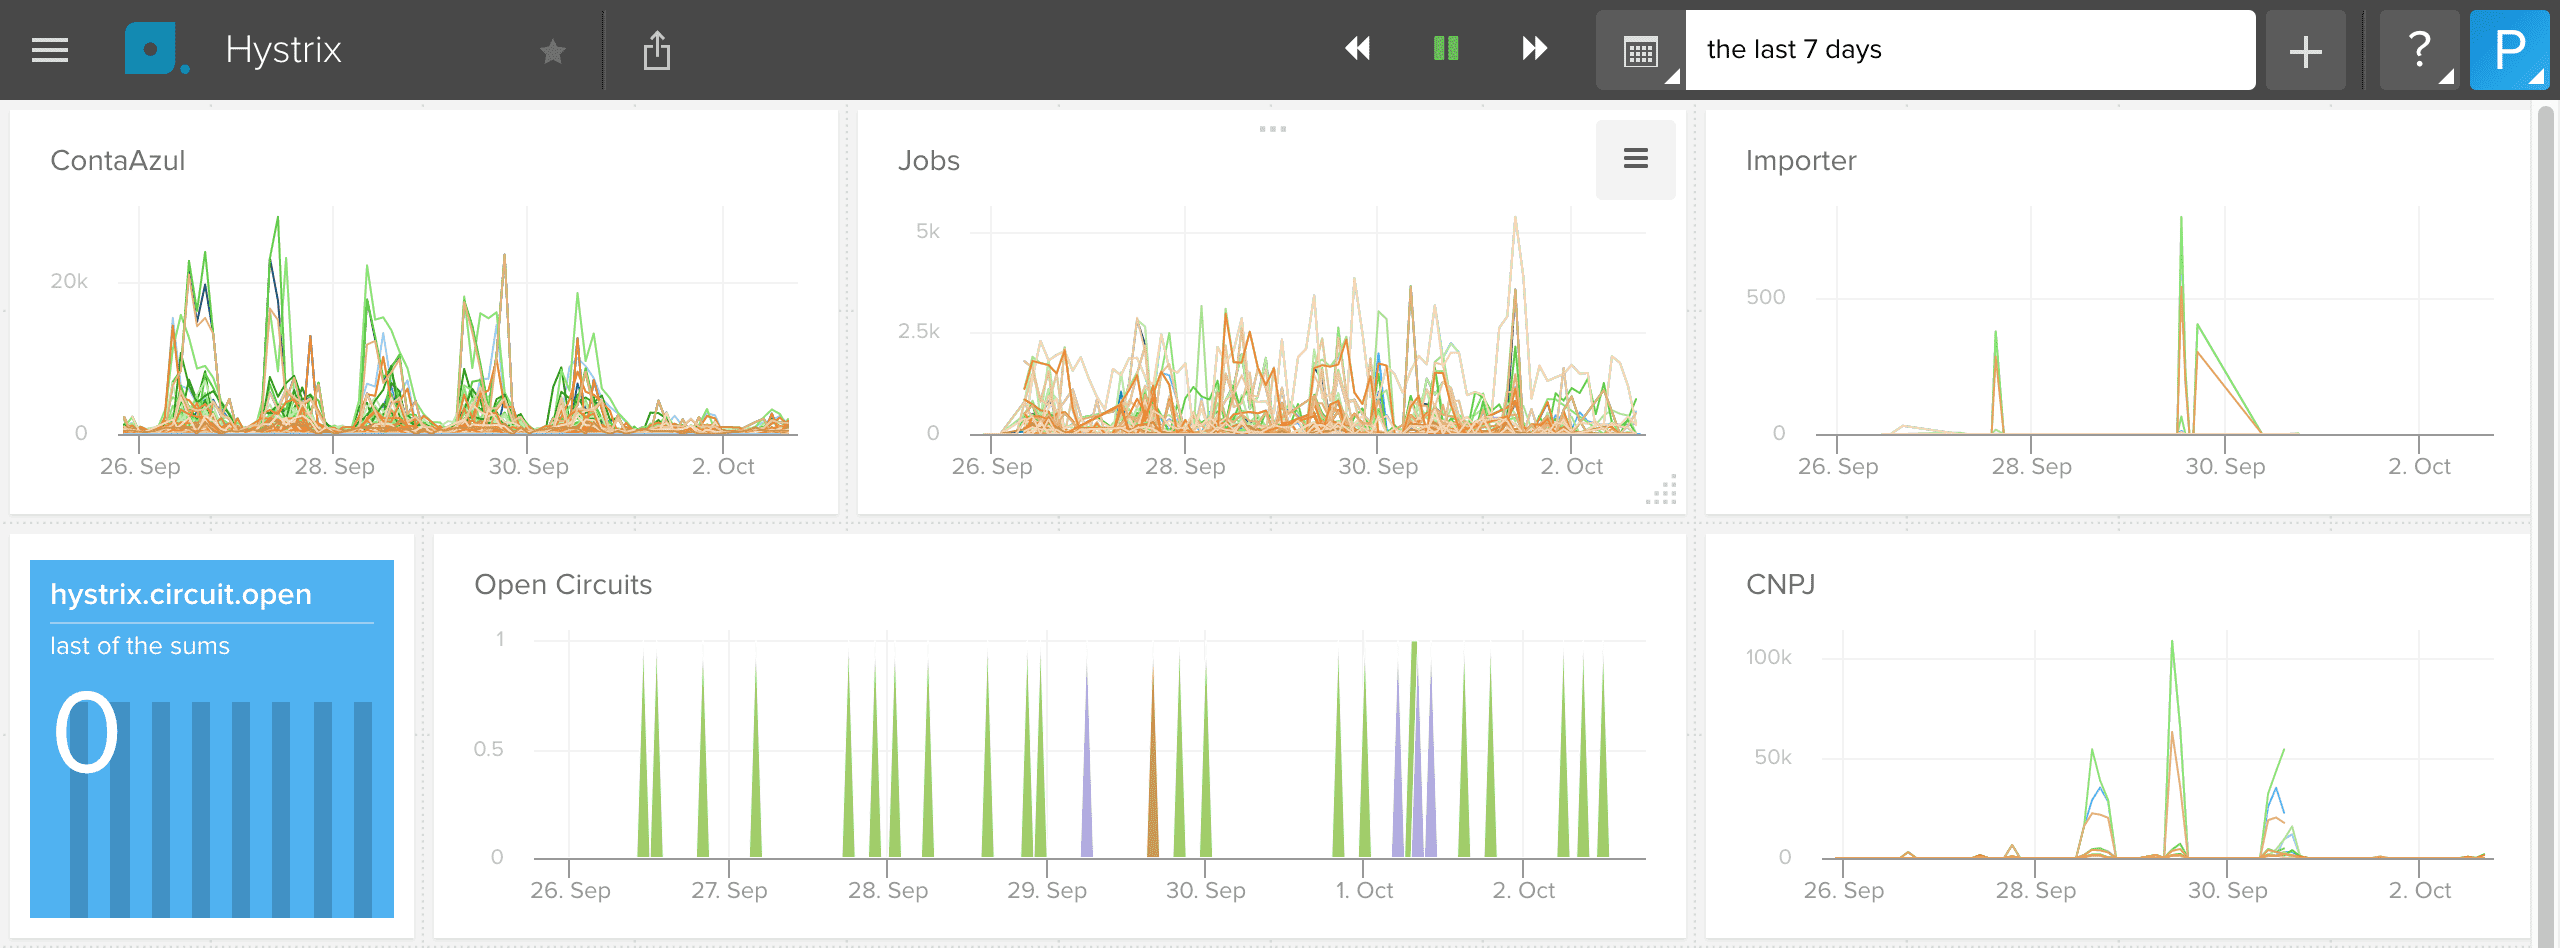
A Librato dashboard
This can also be applied to logs and other relevant information. Keep at least some days of history, so you can find out patterns and solve root causes.
If an alert fires, it should show you other relevant information. Related metrics and other triggered alerts are a good start. But sometimes the tools you use don’t do that.
If that’s the case, dashboards usually help:
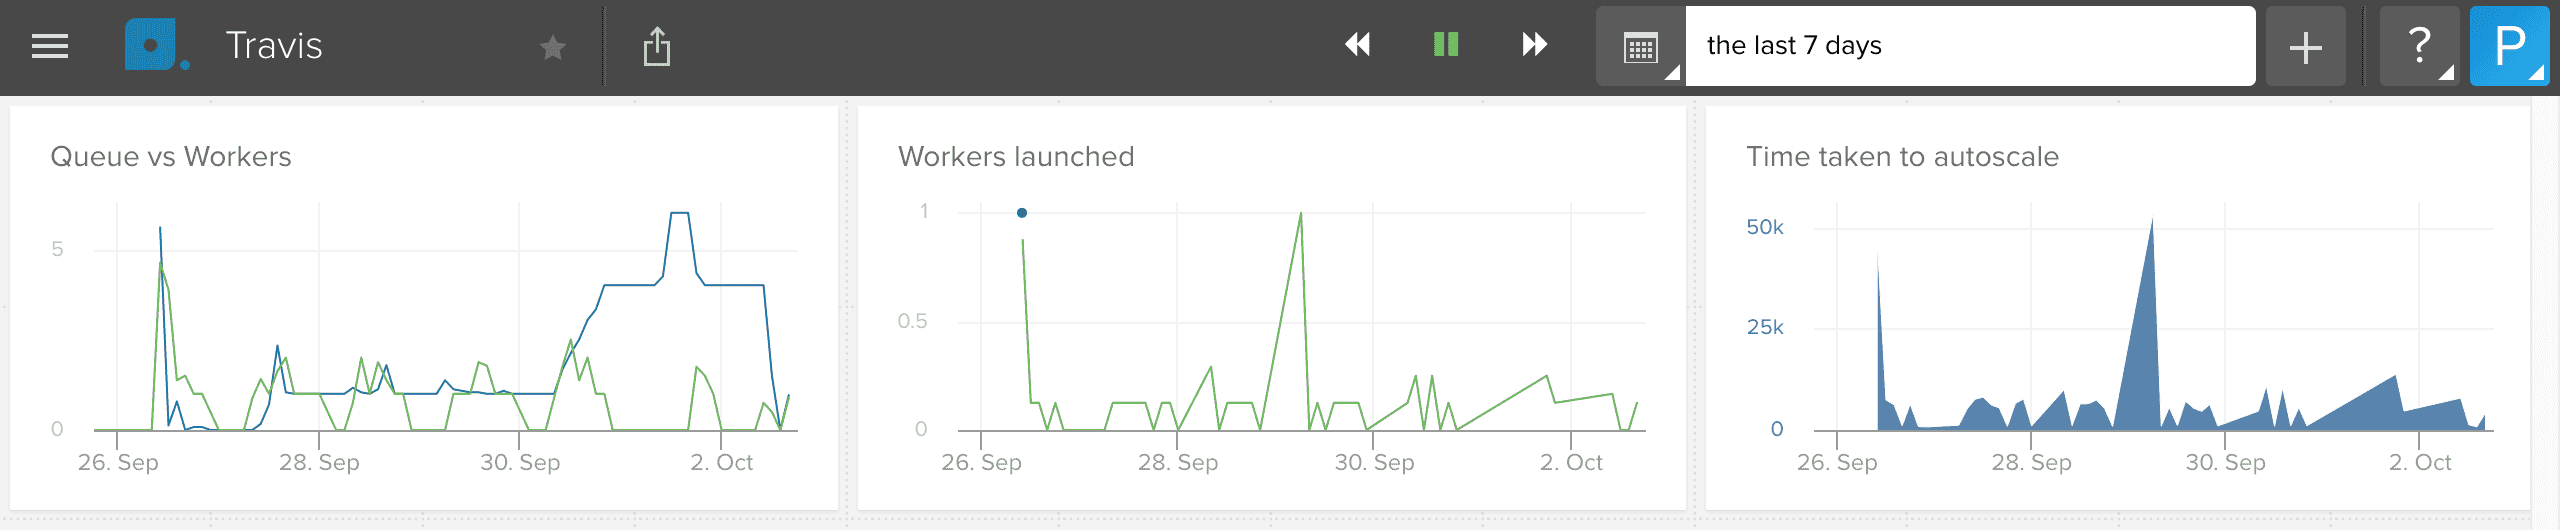
Another Librato dashboard
Remember that dashboards only work if you know where to look at, and sometimes you don’t.
The best approach is to use proper tools for that. There are a few alerting systems out there, like PagerDuty and VictorOps. They can correlate and rank alerts, as well incident escalation.
We are not quite doing it yet, but I promise I’ll write a post about it when we do. 😉
Let’s say is 3 in the morning, you’re sleeping and kind of drunk.
An “App is down” alert would need your attention right now (please don’t drink and root).
But, an alert saying that the disk of some server will be full in 3 days doesn’t.
An alert should fire if and only if it requires human intervention ASAP.
Otherwise, they should generate low-priority tasks.
This is also sometimes hard to do, and, like the previous item, there are tools that help you do that.
Monitoring distributed systems is hard.
It isn’t simple to put just the right amount of monitoring and alerting.
It requires constant work and improvements.
everything is fine
— @sadserver, July 8, 2015
My team and I are constantly working on improving our alerting and metrics.
The items described here are helping us get cleaner inboxes and less noise.
This means we have more time to work on what matters.
I hope they help you and your team too.