Using AI to aid color scheme migrations
Recently I found a good use case for AI when migrating my dotfiles to another theme. This is a …
This is the story on how I speed up my terminal load time.
Some time ago I shared my dotfiles to the world.
I was never really happy with the shell load time, though. Most of it was spent by antigen loading the plugins I use. By then, my shell was taking almost 10 seconds to load. To address that issue, I created antibody. My shell went from almost 10 seconds to ~2 seconds. It was a huge step, still, I was no happy about it.
Today, I decided to go and figure out why. The first step was to gather data on why it was so slow:
for i in $(seq 1 10); do /usr/bin/time zsh -i -c exit; done
  1.11 real         0.48 user         0.57 sys
  0.82 real         0.47 user         0.42 sys
  0.83 real         0.47 user         0.43 sys
  0.86 real         0.48 user         0.44 sys
  0.82 real         0.47 user         0.42 sys
  1.21 real         0.48 user         0.42 sys
  0.80 real         0.46 user         0.41 sys
  0.82 real         0.47 user         0.42 sys
  0.82 real         0.47 user         0.42 sys
  1.40 real         0.48 user         0.42 sys
As we can see, it took ~1 second for each shell load. It might feel fast, but for a shell to open it is not.
So, to find out where the slowness was, I ran zsh -i -c -x exit. I spend some time looking at all that debug info and found that much of that time was being spent by rbenv init command. So, I lazy loaded it:
-# shellcheck disable=SC2039
-if rbenv &>/dev/null; then
-  eval "$(rbenv init -)"
-fi
+
+rbenv() {
+  eval "$(command rbenv init -)"
+  rbenv "$@"
+}
I know, I changed the way the program behave by doing that, but I think it’s worth it.
I did the same with antibody and pyenv and remove some unneeded if statements (e.g. [ ! -d "$GOPATH" ] && mkdir -p "$GOPATH/bin") and simplified some PATH changes (e.g. replacing to exports with one).
Then, I measured it again:
for i in $(seq 1 10); do /usr/bin/time zsh -i -c exit; done
  0.73 real         0.43 user         0.35 sys
  0.72 real         0.42 user         0.34 sys
  1.10 real         0.43 user         0.35 sys
  0.72 real         0.42 user         0.35 sys
  0.75 real         0.44 user         0.36 sys
  0.73 real         0.43 user         0.35 sys
  0.74 real         0.43 user         0.35 sys
  0.73 real         0.43 user         0.34 sys
  0.73 real         0.43 user         0.35 sys
  0.73 real         0.43 user         0.34 sys
That improved a little. But I wanted more.
So, I look for if statements that check if a program exists by calling it, for example: if gls &>/dev/null; then.
It turn out I had a lot of them. I fixed them by doing stuff like:
-if gls &>/dev/null; then
+if which gls >/dev/null 2>&1; then
And, measuring again:
for i in $(seq 1 10); do /usr/bin/time zsh -i -c exit; done
  0.43 real         0.22 user         0.25 sys
  0.42 real         0.22 user         0.24 sys
  0.40 real         0.21 user         0.23 sys
  0.40 real         0.21 user         0.23 sys
  0.40 real         0.21 user         0.23 sys
  0.39 real         0.21 user         0.22 sys
  0.40 real         0.21 user         0.24 sys
  0.41 real         0.21 user         0.24 sys
  0.41 real         0.21 user         0.24 sys
  0.40 real         0.21 user         0.23 sys
Wow! The time went from ~0.7s to ~0.4s!
Still, I wanted more!
I looked for more stuff like this, and end up finding one more call to rbenv to check if it exists and also some duplicated zsh completion code.
Fixed those issues and measuring again gave me this numbers:
for i in $(seq 1 10); do /usr/bin/time zsh -i -c exit; done
  0.78 real         0.14 user         0.14 sys
  0.26 real         0.14 user         0.13 sys
  0.28 real         0.15 user         0.14 sys
  0.26 real         0.14 user         0.13 sys
  0.27 real         0.14 user         0.13 sys
  0.25 real         0.13 user         0.12 sys
  0.27 real         0.14 user         0.13 sys
  0.27 real         0.14 user         0.13 sys
  0.27 real         0.14 user         0.13 sys
  0.26 real         0.14 user         0.13 sys
I was almost happy here, if it wasn’t for this 0.78. I debugged a little more and found out that compinit was taking more time on every new shell execution.
I found that it was because it was checking ~/.zcompdump file every time.
I found a hack on a gist and changed it a little to work on OSX, here is what I got:
-autoload -U compinit && compinit
+autoload -Uz compinit
+if [ $(date +'%j') != $(stat -f '%Sm' -t '%j' ~/.zcompdump) ]; then
+  compinit
+else
+  compinit -C
+fi
And, measuring again:
for i in $(seq 1 10); do /usr/bin/time zsh -i -c exit; done
  0.28 real         0.13 user         0.14 sys
  0.26 real         0.12 user         0.14 sys
  0.25 real         0.12 user         0.14 sys
  0.23 real         0.11 user         0.12 sys
  0.25 real         0.12 user         0.13 sys
  0.23 real         0.11 user         0.13 sys
  0.23 real         0.11 user         0.12 sys
  0.24 real         0.11 user         0.13 sys
  0.26 real         0.13 user         0.14 sys
  0.26 real         0.12 user         0.14 sys
Way faster, huh?
Right now, the only ways I found to make it even faster is disabling completion and/or using another prompt, without syntax highlight and history substring search. I don’t want to do that right now, so, I’ll be happy with what I got.
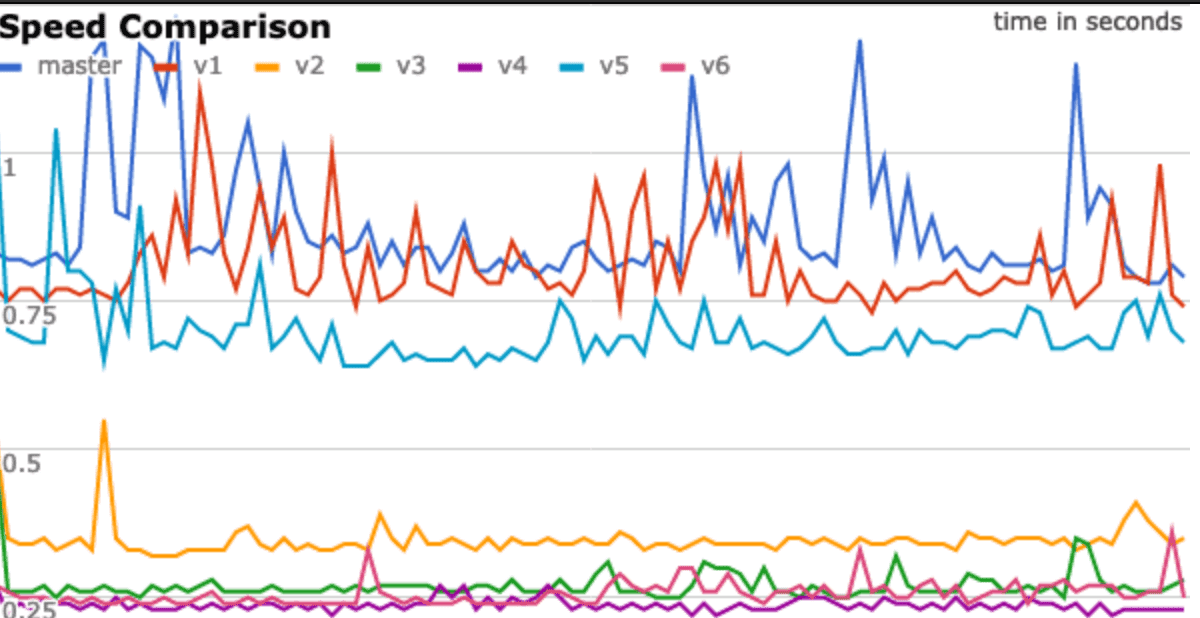
Oh, I also graphed all these things (with 100 executions in a fresh shell):

Speed charts.
For reference, here is the table of mins, maxes, medians and modes for all of them too.
Also, here are the pull requests that did those changes: